What's New


What's New |
|
|
There are many new features in this second major release of Fathom. The new features are described in this section, with links to the appropriate section of Help for details. However, at least as important as the new features are the many hundreds of small improvements that will make learning Fathom easier for both newcomers and experienced users.
Meters and Experiments You can now use a new object called a meter as an interface to external Vernier sensors or to sliders. Connect these meters to a collection to create an experiment. See Work with Meters, Create Experiments
Date/Time Fathom now understands date and time formats for data and sliders. U.S. Census Microdata from 1850 to 2000 A new and easy-to-use interface makes it possible to import historical and current census microdata containing more than 50 attributes about individuals who filled out the long form of the census. See Import U.S. Census Microdata from IPUMS. Units Fathom 2 recognizes and understands units, from pounds to fathoms. This means you can now have data that answer the question “How many what’s?” Unit designations appear on graphs and other objects. You can easily convert from one unit to another; formulaic computations respect units and can include explicit mention of units. See Manage Units in a Case Table or Manage Units in the Collection’s Inspector. See Units for a comprehensive list of built-in units Fathom recognizes. Format Text Objects, Complete with Mathematical Typesetting
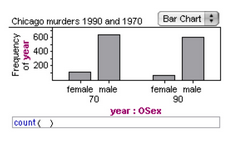
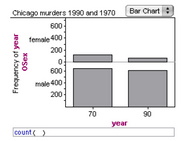
See Format Text in Text Objects. Colors Colors are used to tie corresponding elements together. For example, both the case table and the Cases panel have the same blue shading. Computed values show a gray background. Empty cells have a yellow background. Attribute names, measure names, functions, units, slider names, and constants each have a unique color that is used wherever that kind of word appears. Multiple Attributes on Graph Axes This profound change improves the graphing capabilities of Fathom 1 and makes possible a host of new graphs. See Add Another Attribute to an Already Occupied Axis. Grid Lines and Backgrounds in Graphs You can now make graph displays more meaningful by adding grid lines and image backgrounds to graphs. See Add Grid Lines to Graph, Work with Graph Backgrounds. Error Bars in Scatter Plots You can now account for uncertainties in real-life data by using error bars in scatter plots. See Add Error Bars to Scatter Plots. Link Axes You can now link axes so that their scales match, and stay matched, even when rescaled. See Dynamically Link Axes to Each Other. Graph Properties Now graphs have their own inspectors that allow you to change the size of points and axis bounds, add error bars, determine whether axes will automatically rescale, and even change the direction of increasing numbers. New Bar Charts
Two bar charts, one with side-by-side bars and the other with bars split into multiple groups, are now possible. See Bar Chart and Split Bar Chart. Show Squares to Plotted Functions In Fathom 1 the squares of residuals could only be shown for lines. Now they can be shown for plotted functions. The sum of squares is shown, as well. See Show Squares. Multiple Movable Lines in Bivariate Plots Now you can add any number of movable lines to a bivariate plot. Least-Squares Regression and Median-Median Lines Computed Separately for Each Cell When a scatter plot has been split with a legend attribute, or with multiple attributes on an axis, computing a fitted line shows the line and its equation for each cell rather than a single line for all the data. See Least-Squares Line and Median-Median Line. Plotted Function Tracing As your mouse moves over a line or plotted function in a bivariate graph, a red dot appears indicating where you are, and the coordinates of the dot appear in the status bar. By clicking the mouse, you can display the coordinates directly in the graph. See Trace on a Function or Fitted Line. Powerful New Slider Capabilities Fathom 2 greatly increases slider usefulness while preserving accessibility for getting started with sliders. You can now control animation speed, restrict values to multiples, compute slider value with a formula, refer to collection attributes and measures in a slider formula, and allow self-reference in slider formulas. See Work with Dynamic Parameters (Sliders) or Slider Properties Panel. Linear Models The statistical objects include a linear model object as well as interval estimates and hypothesis tests. See Build a Linear Model. Multiple Linear Regression Model This new statistical object brings important statistical capabilities to Fathom’s dynamic dragging environment. It has its own set of attributes for working with predicted and residual values. See Multiple Regression. Correlation Matrix Add numeric attributes to both dimensions of a summary table, and you get a flexible correlation matrix.
Basic Statistics and Five-Number Summary The summary table now lets you add a set of basic statistics and/or the five-number summary statistics to a summary table with menu commands. See Add or Remove a Summary Table’s Formulas, Add Basic Statistics, or Add Five-Number Summary. Duplicate Object Select a Fathom object and duplicate it. This really helps when you’ve gone to a lot of trouble to get an object just the right size, with the right attributes and the perfect format, and now you want another one that you can modify just a bit. See Duplicate [Object]. Table Join You have two different collections and they both have an attribute that can serve as a key for looking up values. Drag this attribute from one case table to its mate in the other case table to join the two collections. See Add Attributes from Another Case Table Using Table Join. Navigation • Move selected objects with keyboard arrows. •If a case table or text object is selected, Page Up, Page Down, Home, and End keys will navigate through it. •If no case table or text object is selected, Page Up, Page Down, Home, and End keys will navigate through the document. •It is now much easier to navigate through the case table and inspector tables with the keyboard. When editing attribute names in a case table, Tab will take you to the next attribute. When editing attribute, measure, or category names in an inspector, Enter or Return will take you to the next attribute. See Keyboard Shortcuts. Sorting in Graphs and Summary Tables The categories displayed in many graphs and summary tables can now be sorted. See Sort Data in a Graph. See Sort Categories in a Summary Table. Category Sets Use category sets to control how categorical attributes behave: control their order, and force null categories to appear in graphs and tests (for example, in a dice-rolling experiment, when you didn’t get any 3s). See Control Behavior of Categorical Attributes Using Category Sets. Editable Values in Statistical Objects Allow Editing in Place You no longer have to show a formula editor to make a simple change to a value in a statistical object. (But you still can if you need to.) See Enter Summary Statistics in Statistical Inference Objects. Preferences There a few more preferences that Fathom remembers each time you launch it: three default font sizes, an option to not show statistical objects on the shelf (to be less confusing to non-statistics users), an option for the display of linear equations, and the ability to set the default verbosity of statistical objects. See Preferences. Change Case Order and Attribute Order Sorting data in a case table now changes the order of cases in the underlying collection. In addition, changing the order of attributes in the case table affects that order in inspectors, and vice versa. Multiple Attribute Drag You can now select more than one attribute in a case table and put them all in a graph, summary table, or statistical object with one drag-and-drop move. Formula Editor Improvements The formula editor was probably the least-loved object in Fathom 1. It is much improved for Version 2. The most obvious changes are: •Enter or Return now not only accepts the formula, but dismisses the formula editor. •You can change the font size when editing a formula. If you’re having trouble, use a bigger font. •The “left side” of the equation is displayed, indicating that you don’t need to type that. •You can edit a long number by clicking within it and editing (rather than having to replace the whole thing). •To replace a “nugget” within a complex expression, you can now select what you want to replace and type your new text. Don’t delete the offending bit first; just replace it. Pressing the á key will select progressively larger nuggets. •Measures now live in their own list, rather than mixed up with attributes. •We’ve changed the look, rearranged the buttons, and increased the font size for the formula itself. Note the exponent button is now labeled with a ^. •When the cursor is in a denominator or exponent, a tip appears informing the user that the right-arrow key will move the cursor out of the denominator or exponent. Rerandomization Is Much Less Aggressive Under many, but not all, circumstances in which Fathom 1 would rerandomize all computed values, Version 2 will only rerandomize directly affected values. New Functions
Other Improvements •You can now copy a picture of an object (especially a graph) even when cases are selected. •Double-clicking a column boundary in a case table automatically resizes that column to be the correct width to show all its values. A menu command allows you to do this to multiple columns or all columns. •Clicking on cells in a summary table selects all the cases corresponding to that cell. If all the cases corresponding to a cell are selected, the cell highlights. •The command File | Open Sample Document takes you directly into the Sample Documents folder so you don’t have to search for it (provided your sample documents are stored in the same folder as the application). •The Help menu has commands that will open your Web browser to useful online locations. •On the Macintosh, z+? will launch Help. |