Add Another Attribute to an Already Occupied Axis


Add Another Attribute to an Already Occupied Axis |
|
|
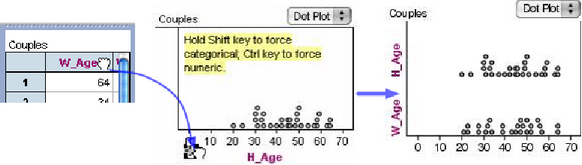
How To... > Work with Graphs > Add Another Attribute to an Already Occupied Axis Once you have an attribute on an axis, you can add more attributes (of the same type) to that axis.
•Drag an attribute to the graph, and drop it directly on top of the plus sign. (When you’re over the right spot, the whole-axis highlighting disappears, and highlighting appears around the plus.)
Fathom adds the attribute to the graph, giving you a split dot plot (or histogram, box plot, etc.). Here are circumstances in which you can add attributes to already occupied axes: •Add as many numeric attributes as you want to a numeric univariate plot (such as a dot plot or histogram). •Add as many numeric attributes as you want to one axis of a scatter plot. •Add one categorical attribute to a bar chart.
See also Replace an Attribute on a Graph with Another Attribute |