Add Grid Lines to Graphs

Top  Previous  Next

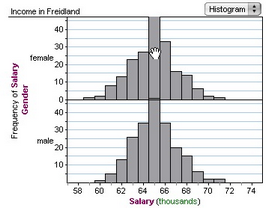
How To... > Work with Graphs > Add Grid Lines to Graph

Grid lines help you to compare values in different parts of the plot.

To add grid lines to a graph,


1.Select the graph.


2.Double-click an axis or the plot area of the graph to show the inspector; if necessary, go to the Properties panel by selecting the appropriate tab.


3.Set the property showXGridlines or showYGridlines to true by clicking in the Value column and choosing true from the pop-up menu.


gridlines