Trace on a Function or Fitted Line


Trace on a Function or Fitted Line |
|
|
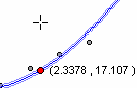
How To... > Work with Graphs > Add Lines and Functions to Graphs > Trace on a Function or Fitted Line When you have functions or fitted lines plotted on a graph, you can force the cursor to stay on the line and have it show its coordinates.
The cursor changes and its position on the line is shown with a red dot.
Because clicking on a movable line selects it for dragging, this feature is not available for movable lines. Instead, you can plot a static line (using Plot Function) and trace that. |