Sort Data in a Graph


Sort Data in a Graph |
|
|
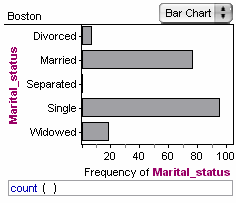
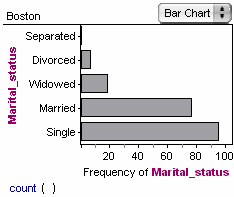
How To... > Work with Graphs > Sort Data in a Graph Fathom can sort the bars or ribbon bands in a graph of categorical data from lowest to highest.
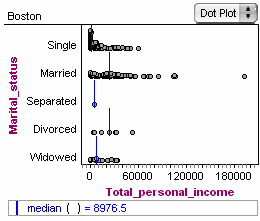
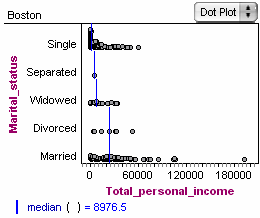
If a category set is applied to the attribute, dragging or sorting categories will change the order of its categories; all objects displaying the attribute will use this new sort order. When you have a split numeric graph with a value plotted on it, you can sort the groups by that value.
If you have more than one value plotted on the graph, first select one by clicking on its expression below the plot, then sort. See also Control Behavior of Categorical Attributes Using Category Sets |