Add Error Bars to Scatter Plots

Top  Previous  Next

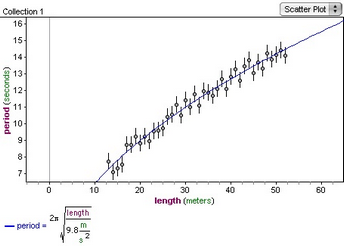
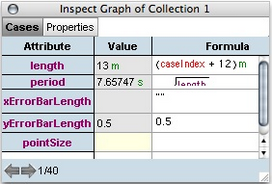
How To... > Work with Graphs > Add Error Bars to Scatter Plots

You can add error bars to scatter plots to capture the uncertainties often encountered in real-life data.


pendulum-eb


1.Select the graph.
2.Double-click an axis or the plot area of the graph to show the inspector.
3.Specify the length of the error bars by editing the formulas for the properties xErrorBarLength and yErrorBarLength.

You can either specify a numeric constant such as 3 or enter an expression in the formula editor. You can assign error bar lengths per point by editing the Value column, but typically error bars are used to capture uncertainties in the entire plot.


Note: Error bars are available only for scatter plots.

graphcasesinsp