Show Squares


Show Squares |
|
|
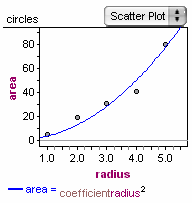
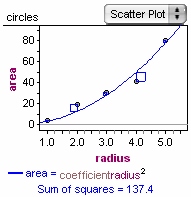
How To... > Work with Graphs > Add Lines and Functions to Graphs > Show Squares When you have a function or line on a scatter plot, you can have Fathom visually show the squared residuals (a great way to illustrate the meaning of the least-squares regression line). •Select the graph and choose Graph | Show Squares.
Fathom constructs vertical segments from every point to the line and then makes those segments into sides of squares. Fathom also displays the sum of the areas of those squares. Show Squares also works with the movable line in a univariate plot. This can be used to show that the mean is a least-squares value for univariate data. You can also use this feature in conjunction with a residual plot. |