|
Fathom Reference > Inspector Panels > Graph Properties Panel
Each graph has its own inspector. Access it by double-clicking anywhere in the graph, or with the graph selected, choose .
Assuming that the graph you are inspecting is plotting data from a collection, the graph inspector will have two panels, a Cases panel and a panel. The panel is similar to the panel in a collection inspector. The panel allows you to change various values that control the graph appearance or behavior.
See Work with Graphs.
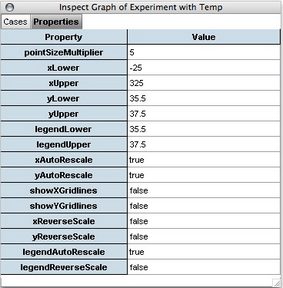
The properties that are listed in the graph’s panel depend on the particular plot that is in the graph. The illustration shows a panel for a histogram.
|
|
The meaning of these properties is explained below.
|
|
This property is specific to dot plots and scatter plots and is the point size multiplier that is used in the point size property in the Graph Cases panel. In absence of a formula for the pointSize, this is the size of the points.
|
|
|
This property is specific to a histogram and is the left boundary of the lowest histogram bar on the horizontal axis. You can change this number to realign the bars. For example, if it were 1 and were an integer, the boundaries of all the bars would be on integer values. This property may change from what you type to reflect the for the first bin, but if the data cover the value typed, there will be one bar boundary on the number you typed.
|
|
|
The width of the bars in the histogram.
|
|
|
The bounds of the horizontal axis.
|
|
|
The bounds of the vertical axis.
|
|
|
The bounds of the legend axis.
|
|
|
Normally, the horizontal axis of a graph has a scale that increases to the right, and the vertical axis has a scale that increases upward. You can reverse either of these scales by changing the value of the property from “false” to “true.”
|
|
|
There are certain circumstances in which Fathom automatically rescales an axis to include all the data. Usually, this is a good thing. But there are situations in which you would prefer that Fathom does not automatically change the scale; for example, as Fathom is plotting measures that are being collected, you might not want it to rescale during that process just because one data point has gone outside the axis bounds. To prevent automatic rescaling, change this property to “false.” You can still force Fathom to rescale the axes by choosing .
|
|
|
This property determines if grid lines are visible in the graph.
|
|


