Least-Squares Line


Least-Squares Line |
|
|
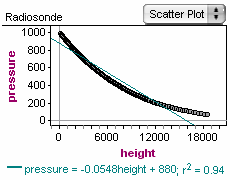
Fathom Reference > Fathom Menus > Graph Menu > Least-Squares Line Available for scatter plots and line scatter plots. Adds a least-squares line to the selected graph, in pale blue; the equation for the line and r2 value are reported below the plot. The equation and r2 value dynamically update when the data are changed (for example, by dragging one or more data points).
When you have more than one attribute on an axis, each gets its own least-squares line.
Re-selecting this command (unchecking it) removes the least-squares line(s) and equation(s).
See also |