Cooling Water—Measure Temperature Over Time
In this tutorial, you’ll gather data from a temperature sensor. While the data are being gathered, you’ll construct a mathematical model of the physical situation and determine whether the model fits the data.
This probably shouldn’t be your first experience with Fathom. You’ll need to be familiar with making collections and graphs, and analysis of the data will be a lot more fun if you’ve learned about plotting functions and using sliders. If you’re brand new to Fathom, try a more basic tutorial!
You’ll need:
- A Vernier temperature sensor—either Go! Temp or Go! Link/LabPro with a temperature sensor.
- A glass that you can fill with hot water. The thinner the walls of the glass, the faster the water will cool.
Making Meters
A meter is a Fathom object that connects to a sensor or to a slider. This experiment requires a temperature meter.
1. Plug the temperature sensor into the LabPro and plug the LabPro into the USB port of the computer.
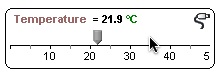
2. Make a temperature meter by clicking on the meter icon and dragging it to the document.
The new meter gets the name Temperature and begins reporting the temperature.
Setting Up the Fathom Experiment
3. In Fathom an experiment is represented by a collection connected to one or more meters or sliders.
4. Make a new, empty collection.
5. Drag the plug from the Temperature meter and drop it on the collection.
Notice that the name of the collection becomes Experiment with Temperature and that the collection icon changes to show that the collection is an experiment collection. Also, the inspector for the collection opens to the Experiment panel.
6. Make a case table for the experiment collection.
The case table has columns for time and for the temperature meter, but no data have yet been gathered.
7. In the Experiment panel of the inspector, click the Turn Experiment On button.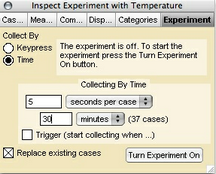
Every second you should see a new case appear in the case table. If so, you’re almost ready to gather the “real” temperature data. If not, make sure the sensor is properly connected to the computer and try again.
8. Press Turn Experiment Off to turn off the data collection.
9. Check Replace existing cases to get rid of the throwaway data.
Performing the Experiment
Fill your glass with piping hot water, place it on the insulating pad, and put the temperature sensor in. You will see the temperature meter’s value rise rapidly as the probe equilibrates to the hot water.
10. Click the Turn Experiment On button.
You might want to change the number of cases per second in the inspector to something less frequent—perhaps 5 seconds per case. You can start analyzing the data while it is being gathered. There is no need to stop the experiment.
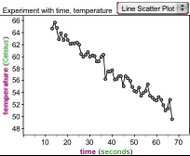
11. Make a line scatter plot showing Temperature versus Time.
As additional data is gathered, the scatter plot updates.
Explore More
- Fit a function to your data. Stop the experiment and predict the temperature of the water at some later time. Start the experiment again and see how close (or far) you are.
- Record the temperature of the air over a 24-hour period. Explain the results.
- Does stirring a teaspoon of salt into a glass of water change its temperature? How about stirring a bit of baking soda into some vinegar?