Plot a Function on a Graph


Plot a Function on a Graph |
|
|
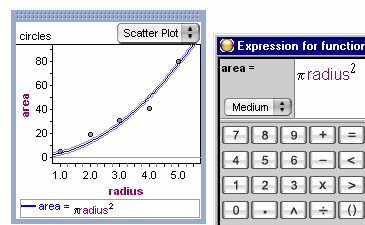
How To... > Work with Graphs > Add Lines and Functions to Graphs > Plot a Function on a Graph You can plot functions on a scatter plot and on univariate numeric plots. For example, suppose you had measured the radii and areas of circles. Here is how you would plot a fitted curve:
1. Select the graph. 2. Choose Graph | Plot Function.
3. In the formula editor, enter the function. In this example, you would type pi*radius^2. (Note how ^ made an exponent, and how pi was converted to π.) 4. Click OK or press Enter or Return to accept the formula and close the formula editor. Note: You can use any symbol for the independent variable when you specify a function to plot. Fathom assumes you mean the predictor (the attribute on the horizontal axis). Using the actual attribute name can be useful, however, because then you can copy and paste the formula (to an attribute, for example, to make a predicted value), and it will work without modification.
If you aren’t sure exactly what to plot, you can use one or more sliders in the formula and change the sliders to change the curve dynamically. See Plot a Function You Can Vary Dynamically (Using a Slider).
See also |