|
How To... > Work with Graphs > Add Lines and Functions to Graphs > Plot Functions on a Function Plot
Although specifically designed for working with data, Fathom’s graph objects can also be used as function plots. These plots are especially powerful when the functions are governed by one or more .
| 1. | Make a new, empty graph by dragging one from the or choosing . |
| 2. | From the graph’s pop-up menu, choose . |
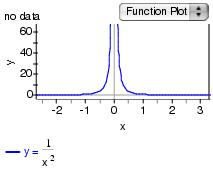
| 3. | Choose to show the formula editor, and enter the function you want to plot. |
| 4. | Click or press Enter or Return to accept the formula and close the formula editor. |
By making one or more sliders and using their names in your functions, you make the functions dynamic. Drag the slider and watch the function change. See Plot a Function You Can Vary Dynamically (Using a Slider).
You can add as many functions (or values) as you want to a graph.
Dropping an on a function plot will remove everything plotted on it.
|