Add Fitted Lines to a Graph


Add Fitted Lines to a Graph |
|
|
How To... > Work with Graphs > Add Lines and Functions to Graphs > Add Fitted Lines to a Graph
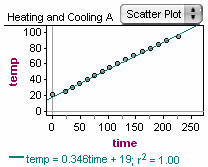
You can plot two different kinds of fitted lines on a scatter plot: the least-squares line and the median-median line (see What Is a Median-Median Line?).
The corresponding line appears on the graph, and its equation appears below the plot area. Choose the command again to remove the line. •You can force a least-squares line to go through the origin by choosing Graph | Lock Intercept at Zero. Note: The least-squares and median-median lines update dynamically as the data change. (Drag a data point to see whether it influences the line.) When you have a multiattribute scatter plot (more than one attribute on a given axis), you get a line and equation for each. See also |