|
How To... > Work with Graphs > Add Lines and Functions to Graphs > Plot a Function You Can Vary Dynamically (Using a Slider)
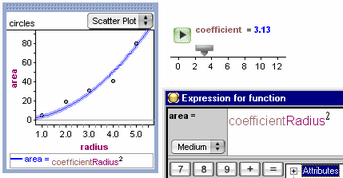
Suppose you’re trying to fit a function to data in a scatter plot, but you aren’t sure exactly what value you should use for some part of the function (coefficient or exponent, for example). You can make a slider and use its name for that part of the function. When you change the slider’s value (by dragging or typing), the function updates dynamically.
| 1. | Make a slider by dragging one from the or choosing . |
| 2. | Give the slider a meaningful name (such as denominator). |
This shows a formula editor.
| 5. | Define the function you want plotted, and click or press Enter or Return to accept the formula and close the formula editor. |
If you are already editing a function when you decide to use a slider, you can put the slider’s (future) name in the formula and make the slider after closing the formula editor. (Your graph will have a #Name Not Recognized# error that goes away once you’ve created and named a slider.)
See also
Show Squares
Make a Residual Plot
Trace on a Function or Fitted Line
|