Work with Graphs


Work with Graphs |
|
|
How To... > Work with Graphs
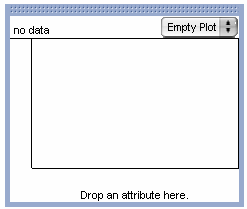
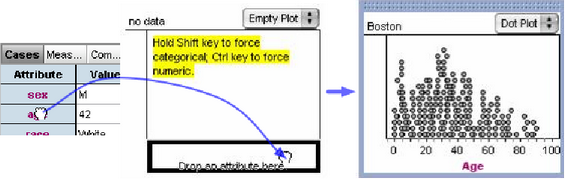
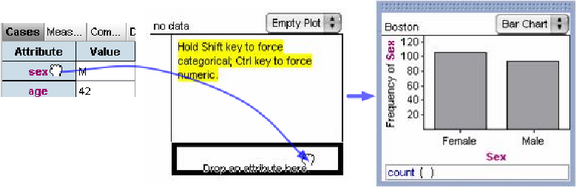
The first sequence shows graphing a numeric attribute, and the second shows graphing a categorical attribute.
The prompt that appears in the graphs tells you how to force Fathom to treat your numeric attribute as categorical or to ignore categorical values and plot only numbers in a categorical attribute. Most of the time, you just drop what you want to see, so you can ignore the prompt. (For more detail, see Force a Categorical Attribute to Be Treated as Numeric and Control Behavior of Categorical Attributes Using Category Sets.) This produces a graph of the data, though it may not be the kind you want.
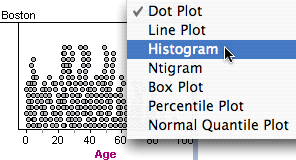
Here are some things to know about graphs: •You can make as many graphs as you want. When you select one or more cases in one graph, they appear selected everywhere (in other graphs, the collection, or tables). (see Select Data in a Graph and Drag Data in a Graph.) •If you want to replace an attribute with another, just drop the new attribute on top of the old one. You can add attributes to the other axis, drop them in the middle of the plot, or even (in many cases) add a second attribute to the already occupied axis. (see Replace an Attribute on a Graph with Another Attribute or Add Another Attribute to an Already Occupied Axis or Add an Attribute to the Middle of a Graph.) •When a graph is selected, the Graph menu appears in the Fathom menu bar. To make the Graph menu appear, select the graph you want to work with. You can see each kind of graph Fathom can make by browsing Graphs Available in Fathom. See also |