Beginner Graphing


Beginner Graphing |
|
|
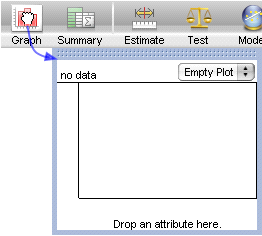
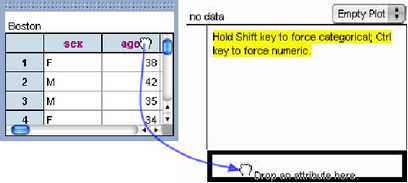
Getting Started > Beginner Graphing To see your data in a graph, make an empty graph, then drop an attribute on one of its axes. (If you want, you can put attributes on both axes or drop them in the middle of your graph as well.)
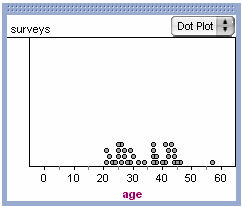
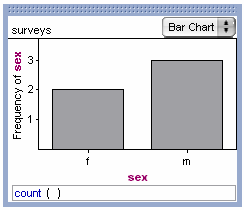
You get a graph. If the attribute you graphed was numeric, you get a dot plot; if it was categorical, you get a bar chart.
Change the graph’s type using the pop-up menu at top right in the graph. You can add an attribute to the same axis, to the other axis, or in the plot area. See Replace an Attribute on a Graph with Another Attribute, Add Another Attribute to an Already Occupied Axis, or Add an Attribute to the Middle of a Graph. You can have as many graphs as you want. If you select data in one graph, it will be selected everywhere. See Select Data in a Graph. With just some data and graphs, you can go far in data exploration and analysis. Of course, there’s much more you can do in Fathom, as described in the rest of Fathom Help. See also |