Dot Plot


Dot Plot |
|
|
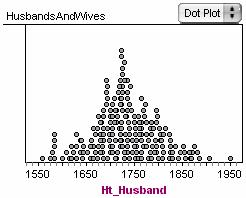
Fathom Reference > Graphs Available in Fathom > Graphs with Numeric Attributes on One Axis > Dot Plot In a dot plot, there is one point for each case. •Drop a numeric attribute on an empty graph (or replace a categorical attribute with a numeric).
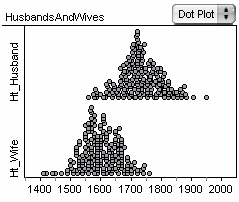
The dots are stacked by default. You can unstack the dots by unchecking Graph | Stack Dots. This aligns the dots in one line to better get an idea of sum of squares from a given value. Split a dot plot by adding one or more numeric attributes to the same axis or by dropping a categorical attribute on the other axis.
|