Select Data in a Graph


Select Data in a Graph |
|
|
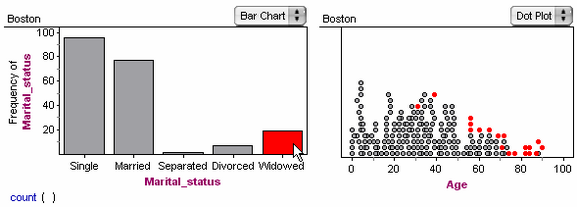
How To... > Work with Graphs > Select Data in a Graph When you select cases in a collection, case table, graph, or summary table, those cases appear as selected everywhere they are visible, providing a simple but powerful technique for exploring your data.
•To select one bar or dot, click it.
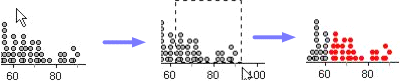
•To select multiple bars or dots, draw a selection rectangle around them. All cases, bars, or bins even partially within the rectangle will be selected.
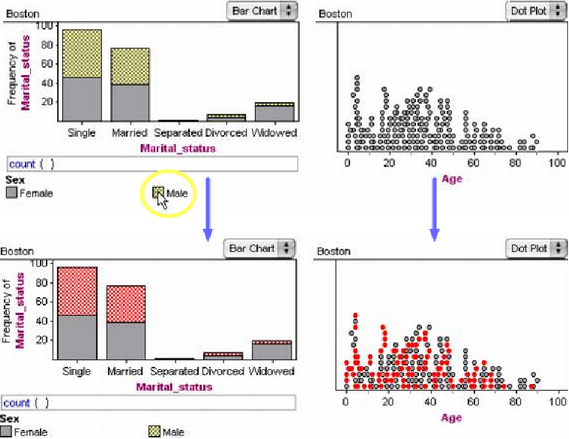
•To select all cases in a category, click the legend symbol for that category.
There is a movie illustrating selection: Selecting Cases. See also |