Add an Attribute to the Middle of a Graph


Add an Attribute to the Middle of a Graph |
|
|
How To... > Work with Graphs > Add an Attribute to the Middle of a Graph When you have a graph with data on an axis, dropping a categorical attribute in the middle of the plot gives you a different kind of splitting than dropping on the other axis. (This is available for graphs that show their data as dots, and for bar and ribbon charts.) If you drop an attribute on an empty graph, it has the same effect as dropping it on the horizontal axis.
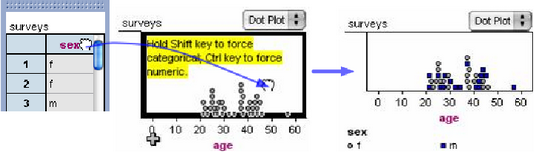
Numeric plot with categorical legend
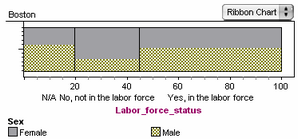
Dropping sex in the plot area of the dot plot of age changes the dots representing the men from gray circles to blue squares (each category gets its own symbol). A legend appears below the plot area. Split categorical plot (by dropping a second categorical attribute in the middle of a bar or ribbon chart)
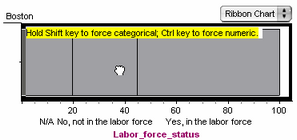
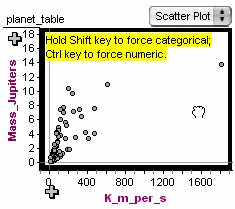
Dropping sex in the plot area of the ribbon chart of Labor_force_status divides each section of ribbon to reflect the proportion of each sex within that labor status category. A legend appears below the plot area. •You can drop a numeric attribute in the plot area of a dot plot or scatter plot.
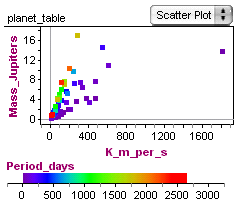
In the scatter plot of mass and speed of extra solar planets, period is dropped in the plot area. Each case is now colored to reflect its period, and a legend appears below the plot area. •Remove an attribute from the graph by selecting the graph and choosing Graph | Remove [AttributeLocation]: [AttributeName]. |