Numerical Integration—The Elevator Experiment
The purpose of gathering data is not always to explore relationships between attributes. Often the purpose is to compute some quantity from the data. In this tutorial, you’ll use data supplied by a force probe to find the distance traveled.
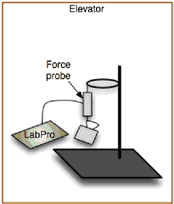
As shown at right, a force probe hangs on a ring stand in an elevator, and a coffee cup hangs from the probe. Force and time data are gathered as the elevator goes from one floor to another. Data collection starts and stops with everything at rest. Which direction and how far did the elevator go? We’ll first find the acceleration of the elevator, and then use numerical integration to find the distance traveled.
Importing the Data
The data from the elevator experiment are in the Sample Documents folder: Tutorial Starters | Elevator Data. There are four files labeled Elevator Data. They all contain the same data, but you will import their data into Fathom in different ways.
1. Start with an empty Fathom document.
2. Follow one of the methods below to import the data.
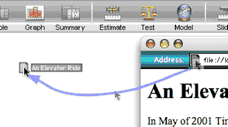
Drag a URL: Open the file Elevator Data Web.html. Drag the URL icon from the address bar of the Web browser into the Fathom document. A collection named Elevator Data Web.html appears in the Fathom document. Open its inspector, and go to the Comments panel. Whatever Fathom cannot decipher as data, it puts in the collection’s comment, to help document the data. (Extra: Copy the picture from the Web browser and paste it into the Fathom document.)
Import from a Text File: Either drag the text file into your document or choose File | Import | Import From File. You’ll get a new collection, Elevator Data Text.txt, in your document. (You could also open the text file in a word processor; select and copy all the text; and paste into an empty collection in your Fathom document.)
Copy and Paste from Excel: Open the Excel document Elevator Data Excel.xls. Select and copy the entire range of filled cells. In Fathom, make an empty collection and paste in the data.
Copy and Paste from Logger Pro: If you have Logger Pro software, you can open the Elevator Data Logger Pro file, and select and copy all the data. In Fathom, make an empty collection and paste in the data.
Graphing Force versus Time
Because you’ve likely done a few tutorials before this one, chances are you won’t have trouble making graphs. But there are a few tricks that will decrease the work and improve the results.
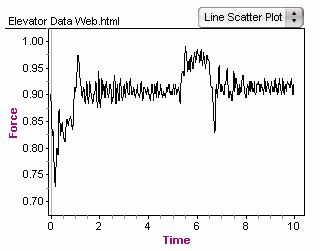
3. Make a line scatter plot with Force on the vertical axis and Time on the horizontal axis.
There about 500 points all crowded together, so it’s hard to see the detailed structure of the graph. We can reduce the point size to see the graph better.
4. With the graph selected, choose Object | Inspect Graph.
5. Change pointSize from 5 to 0.1. Point size is in pixels, and this is small enough that you won’t see any point at all.
6. Also change xAutoRescale to false. (Click on it and type.)
7. Now adjust the horizontal axis to look like the graph at right.
Have you figured out yet whether the elevator went up or down?
Getting the Units Right
The force probe measures force in Newtons and time in seconds. Entering these units will help with graph labeling and with calculation.
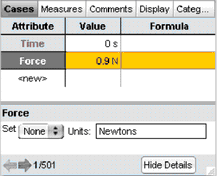
8. Go to the Cases panel in the collection inspector.
9. Click Show Details.
10. Select each attribute in turn and type its unit into the Units edit area.
There are many ways to write the units, but “s” works for seconds, and “N” for Newtons.
Finding the Net Force
When the elevator is at rest, the force probe is measuring the weight of the coffee cup. To find the force of the elevator, we need to subtract this weight, or rest force, from the total force. We don’t actually know the weight of the cup. We’ll use a rough estimate for now and adjust it later.
11. Make a slider named restForce and give it the value 0.9 N.
12. Make an attribute, netForce, with the formula “Force – restForce”.
13. Replace Force on the scatter plot with netForce.
Where there’s a net force, there must be an acceleration. But how much?
Using Force to Find Acceleration
Force equals mass times acceleration. The rest force is the coffee cup’s mass times the acceleration of gravity. Convince yourself that acceleration should be defined as shown below. Notice that Fathom knows the constant gravity (Earth’s gravity), and you can use it as though it were a unit.
14. Define an attribute acceleration with the formula shown here.

The units of acceleration are N/kg. That’s not wrong, but m/s² would be more helpful.
![]()
15. In the inspector, with the details pane showing, select acceleration. Change the units as shown and press Enter. If the units you entered are compatible, all the values will update. If they are not, the old units will remain and the values will appear in magenta rather than in black.
16. Replace netForce on the graph with acceleration.
Notice that each of the three graphs you’ve made so far have the same shape. They differ from one another by a scale factor.
Integrating Acceleration
We’ve converted the force of the elevator to acceleration. Now, to find the distance traveled, we need to integrate (twice). Our graph is not a smooth function, but we can integrate over many small areas to find the velocity at any given time. This is called numerical integration.
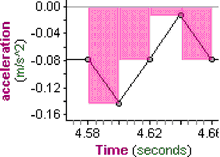
We’ll approximate the effect of acceleration over time by saying that the acceleration at a given time has acted constantly over the preceding time interval. If we magnify a small section of the graph and add rectangles whose area is the acceleration at a given time multiplied by the time interval, as shown at right, the area of each rectangle corresponds to an increment in the velocity. The velocity at any given time is the sum of the areas of the rectangles that precede it.
17. Define a new attribute, velocity, with the formula shown below.
![]()
The prev function returns the previous value of the attribute and, if you don’t specify otherwise, returns 0 for the first case.
Notice that the units of velocity are m/s. This is a good check on the reasoning that goes into the formula.
18. Select the graph of acceleration and choose Object | Duplicate Graph.
19. Move the new graph so that it doesn’t overlap the existing one.
20. Replace acceleration with velocity in the new graph.
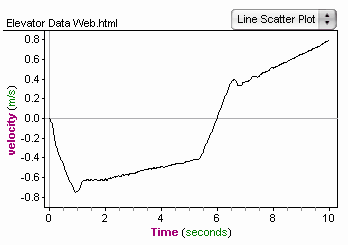
There’s a problem! The graph shows that the ending velocity was not 0 m/s. But the conditions state that everything was at rest at the end of data collection. What went wrong?
Recall that restForce was an approximation. Now is the time to adjust it.
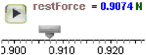
21. Expand the scale on the restForce slider and adjust it so that the ending velocity is 0 m/s.
(Adjusting the rest force parameter is a bit like zeroing your bathroom scale.)
Finding the Distance Traveled
During each small time interval, the velocity can be considered constant. The velocity times the length of the interval gives the distance traveled during that interval. It’s numerical integration again.
22. Define an attribute distance and give it a formula analogous to the velocity formula.
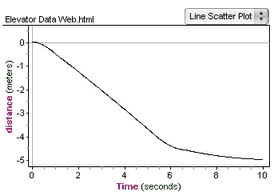
23. Make a graph of distance versus time and read off the final distance traveled. Which way did the elevator go?
The building in which these data were gathered has a balcony, so it was possible to measure the distance the elevator traveled with a tape measure. This measurement agreed with the computed value to within a couple of centimeters!
Going Further
- Interpret each section of the graphs. Go for a ride in an elevator and compare that experience with what the graphs suggest.
- Investigate the sensitivity of the distance traveled to changes in restForce. If you change restForce by 0.1%, by what percentage does the distance change?
- In the tutorial, we assumed that the force is constant for the preceding interval of time. This clearly does not apply to the first data point. Adjust the numerical integration to take this into account. How much does this adjustment change the distance traveled?