Change Axis Scales


Change Axis Scales |
|
|
How To... > Work with Graphs > Change Axis Scales When you first make a graph, Fathom scales the axes so that all the data are visible. But you often want to change the scale of the axes to study features of the graph more closely. There are three ways to accomplish this. You can Change Axes by Dragging, Change Axes Numerically, or Zoom In or Out in a Graph. You can also Reverse a Graph’s Axis Scale, Prevent Graph Axes from Automatically Rescaling, or Dynamically Link Axes to Each Other.
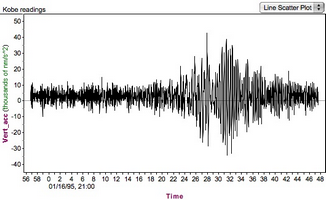
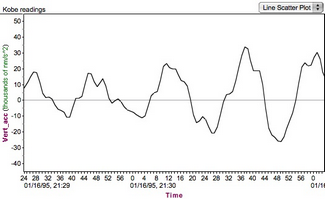
In the first graph, you see the movement caused by the Kobe earthquake over its entire duration. In the second graph, after zooming in to a time slice of three minutes, the graph axes scale automatically to show ticks in terms of seconds. To watch movies illustrating some of these techniques, see Rescaling Axes and Zooming in Graphs. |