Plot a Line at a Given Value on a Graph


Plot a Line at a Given Value on a Graph |
|
|
How To... > Work with Graphs > Add Lines and Functions to Graphs > Plot a Line at a Given Value on a Graph You can plot a value on a graph with a numeric axis.
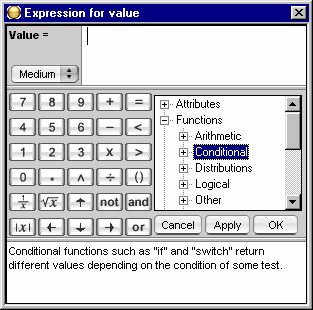
The formula editor appears.
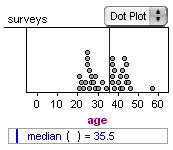
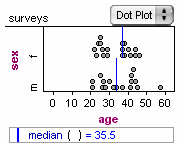
The formula result appears as a colored line and as a color-coded value at the bottom of the plot. Note: If you leave the argument of a function blank, Fathom will use the attribute on the axis as the function’s argument. You could, instead, use the name of another attribute in the formula. You can plot as many values as you want. If the graph is split, a line appears for each subgroup; the value reported below is for all the data in the graph.
See also |