Add a Movable Line to a Graph


Add a Movable Line to a Graph |
|
|
How To... > Work with Graphs > Add Lines and Functions to Graphs > Add a Movable Line to a Graph
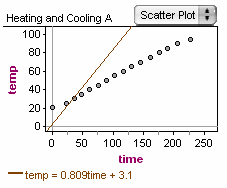
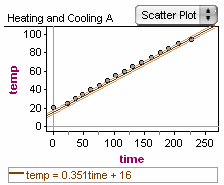
You can add an unfitted, movable line to any graph that has at least one numeric attribute.
If the graph has numeric attributes on both axes, you get an oblique line, and its equation appears below the plot. Dragging that line by its middle keeps the slope but changes the intercept (translates the line); dragging by either end changes the slope (rotates the line). The cursor you get when you are over the line changes to tell you which kind of drag you’re about to perform. (Watch the movie Movable Lines in Scatter Plots to see how to move this line.) If the graph has numeric attributes on only one axis, you get a line perpendicular to that axis, and the value of that line appears below the plot area. Drag the line to move it, and the value updates dynamically. You can add more movable lines by choosing Graph | Add Movable Line again. •Remove a movable line by selecting it (click it or its equation) and choosing Graph | Remove Movable Line. See also |