Plot Values or Functions with Units


Plot Values or Functions with Units |
|
|
How To... > Work with Graphs > Add Lines and Functions to Graphs > Plot Values or Functions with Units
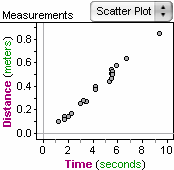
When you want to plot a value on a graph with units, you must include the units for any numbers in the formula. For example, if you were to try to plot the value 5 on this graph, no line would show because 5 doesn’t have units. But the value 5s will show just fine because it has the right units.
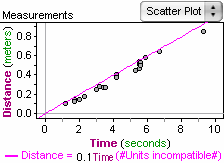
Fathom is slightly more forgiving with plotted functions than plotted values. For example, an attempt to plot 0.1 Time on the graph at right shows the line even though the values have units of seconds instead of meters. But the color of the plotted function is magenta, the color Fathom uses for invalid values, and the #Units incompatible# error appears to the right of the equation. Instead, plot the function
|