Make a Residual Plot


Make a Residual Plot |
|
|
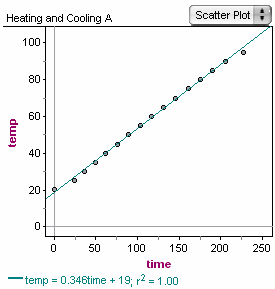
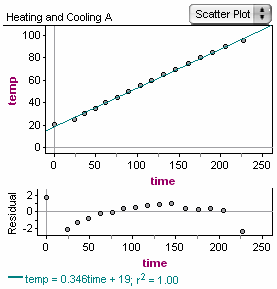
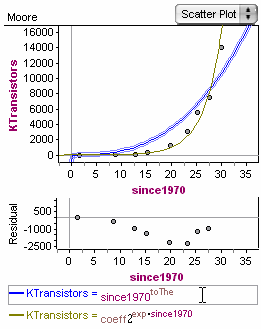
How To... > Work with Graphs > Add Lines and Functions to Graphs > Make a Residual Plot When you have a function plotted on a scatter plot, you can create a residual plot. You can do this with plotted functions or lines. Residual plots help you improve and evaluate your mathematical model. In a residual plot, each point’s vertical coordinate is set to its vertical distance from the function on the original graph. So points a little above the curve in the original will be slightly positive, below the curve, will be negative. This feature is available when you have selected a scatter plot with one line or function. If you have more than one thing plotted, you need to select the line or curve from which you want residuals plotted (click the line or its equation to select it). •Choose Graph | Make Residual Plot.
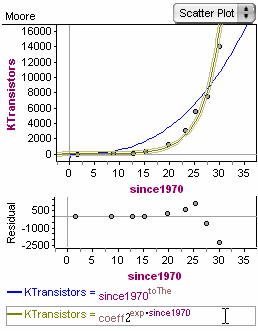
The residual plot is always about half the height of the main plot. Note: The vertical scale on the residual plot may be very different from the scale in the original. Residual plots can help you see features that are invisible on the original graph. If you have a graph with more than one thing plotted on it, you can change the focus of the residual plot by selecting a different equation or line.
|