Test for a Difference in Medians Between Two Groups


Test for a Difference in Medians Between Two Groups |
|
|
How To... > Create Simulations > Simulation Examples > Test for a Difference in Medians Between Two Groups
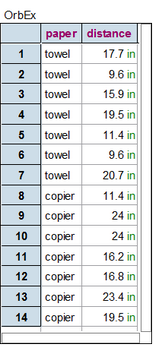
Here we work through a simulation in which scrambling helps us decide whether or not an observed relationship between two attributes is significant. Suppose we have conducted an experiment in which we drop crumpled-up paper from a certain height above a target. After each drop, we measure the distance of the paper from the target. There are two kinds of paper, copier paper and paper towels, and we are interested in whether there is a difference in the distances they land from the target. The data are shown here. To work through this example, create this collection (or use a similar collection of your own data). We’ll use the difference between the two medians, 3.6 in., as our measure of difference. How likely is this value to occur by chance?
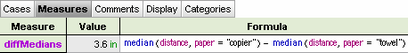
The formula for diffMedians is:
A new collection, Scrambled OrbEx, is created.
In the scrambled collection’s inspector, notice that the diffMedians measure is defined and that it computes the difference of medians for the two groups.
You could have used the pop-up menu to scramble distance instead of paper. (Would it make a difference?)
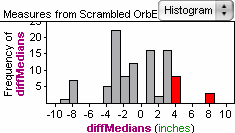
The results of 100 scramblings are shown. Of the 100 scramblings, 11 have a difference of medians greater than those in the original collection; thus we cannot rule out chance with much confidence. |