Simulate Brownian Motion


Simulate Brownian Motion |
|
|
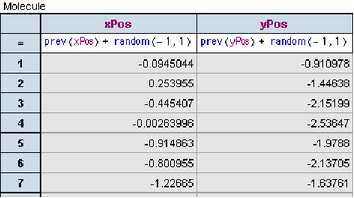
How To... > Create Simulations > Simulation Examples > Simulate Brownian Motion Suppose we have a molecule bouncing around randomly, and we want to know how far from some starting location it ends up after a certain number of bounces. A simulation can tell us. We’re going to assume that the molecule lives in a two-dimensional space and that on any given bounce it goes between -1 and +1 in the x-direction and between -1 and +1 in the y-direction measured in some units, such as micrometers. We’ll simulate 100 bounces and see how far the molecule gets.
Because we didn’t give the prev function an initial value, the molecule will start at point (0, 0). It hasn’t gone anywhere yet; there are no steps or cases.
Your case table should look similar to the one shown above.
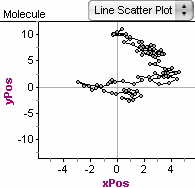
This graph represents the motion of the molecule. Each time you choose Rerandomize from the Collection menu, you see a new possible path. If you adjust the axes to go roughly from -10 to 10 in both dimensions, you’ll usually be able to see the whole “walk” after each rerandomization (if you leave the axes at their default, you have to keep rescaling the axes to see each random walk).
We want this measure to compute how far the molecule is from the origin in the last case. 10. Double-click the Formula cell for the distance measure, and give it the following formula:
By squaring each final position, then taking the square root of their sum, we get the distance from the origin, regardless of the direction.
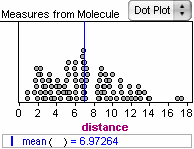
11. With the Molecule collection selected, choose Collection | Collect Measures. The molecule collection rerandomizes five times and a new collection, Measures from Molecule, appears. It contains the final distance from the origin for each walk. 12. Double-click it to show its inspector. 13. Set the inspector’s Collect Measures panel to collect 100 measures, and click Collect More Measures. Here is a dot plot showing 100 sets of 100 steps each. How do you think the result would differ if, instead of 100 steps, we allowed 1000?
|