|
How To... > Create Simulations > Simulation Examples > Probability of a Pair
A deck of cards is made of spades only. The cards are shuffled, and the first card is drawn. The value is written down, the card put back in the deck, and the deck shuffled again. A second card is drawn. What is the probability that the two cards were the same? Theoretically, the probability is 1/13, because it doesn’t matter what card is drawn first and the probability is 1/13 that the second card will match the first. Let’s see how to construct a of the situation.
We’ll start with a collection of just two cases, one for each drawn card. (A sampling simulation would be more faithful to the scenario but slightly more complicated to construct.)
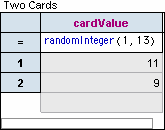
| 1. | Make a collection with two cases and an cardValue with the formula randomInteger(1,13) |
Now we need a that detects when the two cards are equal. We’ll use this opportunity to introduce the extremely useful uniqueValues function.
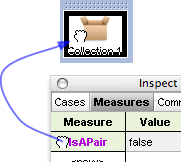
| 2. | In the panel of the collection’s inspector, make a measure named IsAPair and give it the formula uniqueValues(cardValue)=1 |
Convince yourself that this measure does the right thing by rerandomizing a bunch of times (). You could, of course, record the results of rerandomization by hand, but the beauty of using a computer is that you can automate the process. In Fathom, that’s done by collecting measures.
| 3. | Make an empty collection and drag the IsAPair measure from the inspector onto the empty collection. |
You should see five gold balls fly from the collection to the newly named Measures from Two Cards collection. This measures collection now has five cases with a single attribute named IsAPair whose values are “true” or “false.”
| 4. | Make a bar chart of IsAPair from the measures collection. |
We want Fathom to collect many more measures so that we can get a reasonable estimate of the probability of a pair.
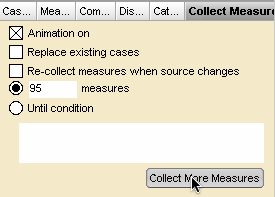
| 5. | Show the measures collection’s inspector, and go to the panel. |
| 6. | Change the 5 to 95 for the number of measures, and click . |
As the measures are collected, you’ll see the bar chart respond. How does the observed probability in this simulation compare with the theoretical value?
See also
Generate a Sampling Distribution
Make a Coin-Flip Simulation
Test for a Difference in Medians Between Two Groups
|