|
How To... > Create Simulations > Simulation Examples > Generate a Sampling Distribution
The concept of a sampling distribution is important in statistics. The idea is that you have defined some statistic for a random sample. Now you sample again and again, keeping the sample size the same and keeping track of this statistic for each sample. The values of the statistic vary, of course, and fall into a distribution. A of these values represents the sampling distribution of the statistic. (More precisely, the histogram approximates the sampling distribution, which is the distribution you would obtain from all possible samples.)
Some statistics, especially those commonly used in statistical practice, are known to have sampling distributions that can be approximated, under certain conditions, by a normal or other probability distribution. For many statistics, however, the only way to come up with the sampling distribution is to use a computer to actually carry out the repeated sampling procedure.
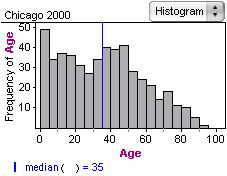
In this example, we create the sampling distribution of the median age of people from a certain collection of individuals from the 2000 census. We consider the collection of 500 ages to be the population. The distribution of ages in the population is shown here. We’ll draw simple random samples of 10 ages and compute the median age for each sample.
| 2. | With the population collection selected, choose . |
This creates a new collection with 10 cases chosen randomly with replacement. If you want to change the number of cases per sample, change the sampling controls in the panel of the sample collection’s inspector.
| 3. | Double-click the sample collection to show its inspector, then choose the tab. |
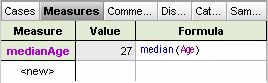
| 4. | Define a new measure, as shown, that computes the median age of the people in the sample. (You can define as many measures as you want.) |
| 5. | With the sample collection selected, choose . |
You now have a measures collection containing five cases, each of which has one value for the median age of people in a sample. (If you defined more than one measure, each measure becomes an attribute in the measures collection.)
| 6. | Double-click the measures collection to show its inspector. |
| 7. | If necessary, go to the panel. |
| 8. | Change the number of measures collected from the default of 5 to 95. |
The collection you get contains 100 values of the median age.
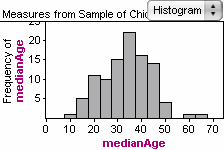
You can graph the data in a measures collection, just as you do with any collection. (Go to the panel, and drop the attribute on a graph.)
The histogram is an approximation of the sampling distribution for the statistic.
|