Plot Value


Plot Value |
|
|
Fathom Reference > Fathom Menus > Graph Menu > Plot Value
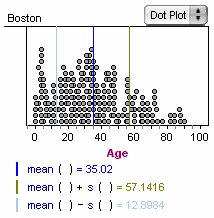
Plots a line at a value on the horizontal axis, determined by formula. This command shows a formula editor into which you can put a numeric value, a slider name, or a function (such as median). A line appears in the plot, and the formula determining it appears below the plot area (color-coded to match the line).
In this example, three values have been plotted (one at a time): the mean and the mean plus and minus one sample standard deviation.
Clearing or cutting a formula removes its plotted value.
See also |