Plot Function


Plot Function |
|
|
Fathom Reference > Fathom Menus > Graph Menu > Plot Function
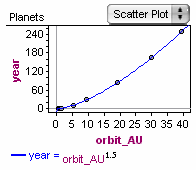
Plots a function determined by formula on a bivariate graph. This command shows a formula editor into which you can enter a function or distribution. (For example, entering only the name of the x-axis attribute gives the line y = x.)
You can plot as many functions on a graph as you want. Clearing or cutting a function’s formula removes that function from the graph.
See also |