Ntigram


Ntigram |
|
|
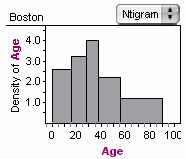
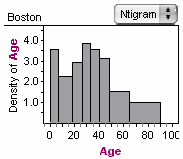
Fathom Reference > Graphs Available in Fathom > Graphs with Numeric Attributes on One Axis > Ntigram In an ntigram, cases are grouped into bins of equal population. The height of the corresponding rectangle is proportional to the density of cases in the bin. You can control the population in each bin by dragging on the bin edge or by using the graph’s inspector. •Drop a numeric attribute on an axis and choose Ntigram from the graph’s pop-up menu.
Split an ntigram either by adding numeric attributes to the same axis or by dropping a categorical attribute on the other axis. |