Histogram


Histogram |
|
|
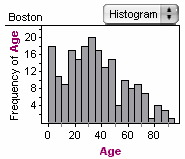
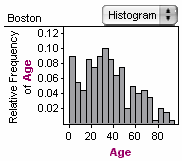
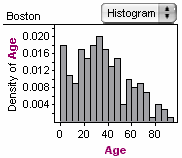
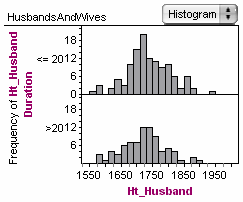
Fathom Reference > Graphs Available in Fathom > Graphs with Numeric Attributes on One Axis > Histogram In a histogram, cases are grouped into bins of equal width. A rectangle represents each bin, showing how many cases are in it. Control the width of the bins by dragging a bin edge or using the graph’s inspector. •Drop a numeric attribute on an axis and choose Histogram from the graph’s pop-up menu. You can change the vertical axis scale by choosing Frequency (the default), Relative Frequency, Relative Percentage, or Density from the Graph | Scale menu.
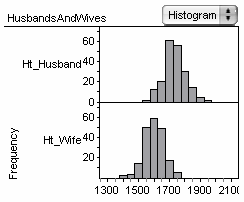
Split a histogram either by adding numeric attributes to the same axis or by dropping a categorical attribute on the other axis.
|