Line Plot


Line Plot |
|
|
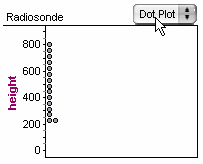
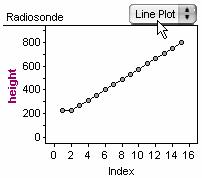
Fathom Reference > Graphs Available in Fathom > Graphs with Numeric Attributes on One Axis > Line Plot In a line plot, there is one point for each case. Points are plotted in case order and connected by lines. This kind of plot is good for time series: You typically put the attribute on the vertical axis. •Drop a numeric attribute on an axis and choose Line Plot from the graph’s pop-up menu.
You can add attributes to the vertical axis. |