Function Plot

Top  Previous  Next

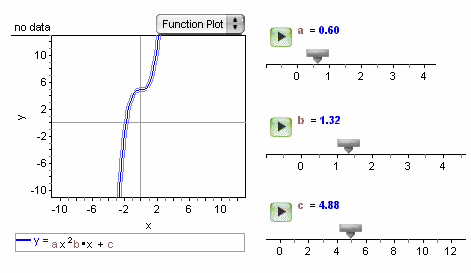
Fathom Reference > Graphs Available in Fathom > Graphs with Numeric Attributes on Both Axes > Function Plot

A function plot is a graph without any data. You can use this plot simply to graph one or more functions.

1.Make a new graph object and choose Function Plot from the graph’s pop-up menu.

_img70

_img71

2.Choose Graph | Plot Function (or Plot Value) to add a function (or vertical line). Use sliders in the formulas to manipulate the functions dynamically. See Plot Functions on a Function Plot or Plot a Function You Can Vary Dynamically (Using a Slider).

_img335