Formulas and the Formula Editor


Formulas and the Formula Editor |
|
|
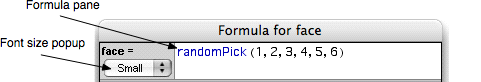
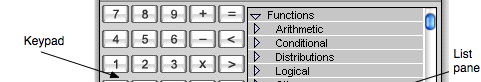
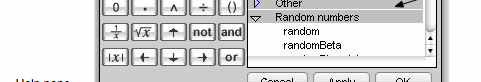
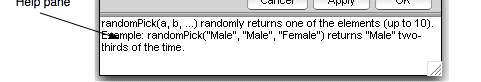
Fathom Overview > Formulas and the Formula Editor Formulas are everywhere in Fathom. They are the driving force of Fathom. You can use formulas as filters to tell which cases you want to see, and you can use them to compute values (including random values) for attributes. You can use formulas to devise statistical measures and to plot formulas as functions against a backdrop of points in a scatter plot. You write formulas in the formula editor. The formula editor is a modal window, which means that you can’t go on to do anything else in Fathom until you’ve closed it. The formula editor supports an array of functions, from trig functions to statistical distributions to conditionals such as if() and switch(). They are all listed in the attribute and function list, which is a pane at the right of the formula editor. Double-click an item in the list to enter it into the formula pane above. You can also enter the item by typing. Select an item to see a description in the help pane. The formula editor displays the names of functions, attributes, measures, and units in special colors. If you type an attribute name or function and it remains black, you probably misspelled it.
The formula editor has four main parts: the formula pane (where you actually put the formula, which tells Fathom what you want to do), an onscreen keypad (simply click a button to put that character into the formula pane), a list pane (from which you can double-click to input functions, attributes, and other things into the formula), and a help pane (which provides brief help on whatever is selected in the list pane). The questions and links below explore further uses of formula editors.
How do I: •plot values and functions on graphs? See Add Lines and Functions to Graphs. •generate random values for an attribute? See Generate Random Values. •transform the values of an attribute? See Define an Attribute by Formula Using the Collection’s Inspector. •recode an attribute so that numeric codes become meaningful names? See Recode Numeric Values to Categories. •restrict the cases displayed in a graph to a subset of those in the collection? See Filter a Graph. •change the computations done in a summary table? See Add or Remove a Summary Table’s Formulas. •change the heights of the bars in a bar chart to be something other than proportional to the count? See Change Bar Charts to Reflect a Function Other Than Count. •build a sampling distribution? See Collect Measures and Other Results. •change the look of the gold balls in an open collection to reflect the actual data belonging to each case? See Change the Appearance of Cases in a Collection. •stop the sampling process when some condition is met, for example, a “run” of three heads? See Make a Coin-Flip Simulation. •use a slider to continuously vary the sample count in a hypothesis test, such as test mean? See Use Sliders to Vary Summary Information in a Statistical Object. •use a formula to set start conditions for an experiment? See Start Based on Conditions. |