|
How To... > Work with Graphs > Change Bar Charts to Reflect a Function Other Than Count
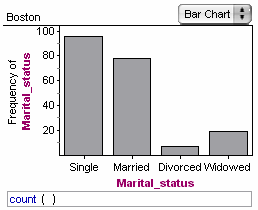
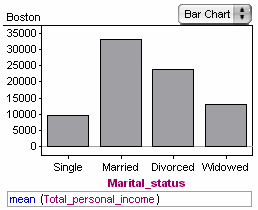
When you put a categorical on a graph, you get a . By default, the height of each bar reflects the number of in that category, and the formula count() appears below the plot area. By editing this formula, you can make the bars reflect some other statistic.
| 1. | Double-click the formula. |
| 2. | Enter the formula you want computed in the graph, and press Enter or Return to accept the formula and close the formula editor. |
|