|
How To... > Work with Statistical Objects > Use Sliders to Vary Summary Information in a Statistical Object
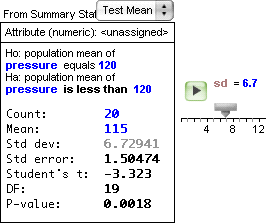
You can use statistical inference objects to explore what-if’s, such as, “What happens to the p-value when the standard deviation changes?” or “How does sample size affect the width of a confidence interval?” To do so, you use a formula that refers to a slider for a field in a statistical object.
| 1. | Create a slider by dragging one from the or choosing . |
| 2. | Give the slider a meaningful name. |
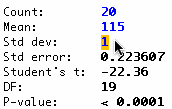
| 3. | Double-click the field in the test or estimate that you want governed by a slider (shown at right for the standard deviation). |
| 5. | Enter the slider’s name, either by typing it or by double-clicking it from the Global Values section of the formula editor’s Functions list. |
| 6. | Close the formula editor by pressing Enter or Return or clicking . |
Notice that the computed value is now gray, indicating it is driven by a formula.
Now, when you drag the slider’s thumb or animate it, the statistical object recomputes its results. You can collect these results in a measures collection and graph multiple results to explore relationships.
|