|
How To... > Work with Statistical Objects > Test Hypotheses > Compare Proportions from Raw Data
If you have categorical data for individual cases and you want to test whether or not an observed difference of proportions for two groups is significant, you can use Fathom’s compare proportions test.
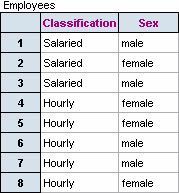
Exactly how you do this depends on which of two basic ways your data are structured. First, consider the preferred data structure. Let’s take a concrete example in which you have a list of 42 employees that includes their sex and job classification (salaried or hourly). You wish to test whether the observed greater proportion of males for salaried as compared with hourly is statistically significant.
The portion of data shown at right shows that each case represents an employee with Classification and Sex as attributes
|
.
|
| 1. | Create a new hypothesis test by dragging one from the or by choosing . |
| 2. | From the test’s pop-up menu, choose . |
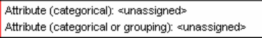
Look carefully at the top pane of the test. Notice, as shown here, that one attribute slot is labeled “categorical” and the other is labeled “categorical or grouping.”
It makes a difference which attribute you assign to each slot. The attribute whose proportions you are comparing (Sex in this example) goes in the first slot. The attribute that defines the groups (Classification in this example) goes in the second slot.
| 3. | Drop the two collection attributes on their slots in the test object. |
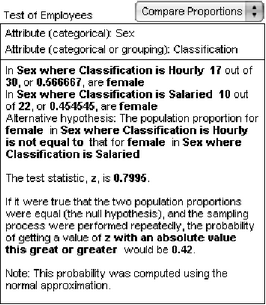
The resulting test object is shown here.
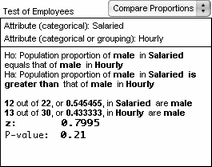
There are two problems with this test object: We want to compare the proportion of males rather than the proportion of females; and our alternative hypothesis is that the proportion of males for salaried works is greater than that of hourly workers.
|
|
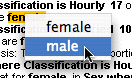
| 4. | Click on the word “female” and choose from the pop-up menu. |
| 5. | Repeat this change for the other occurrence of “female”. |
|
|
| 6. | Click on “Sex where Classification is Hourly” and choose from the pop-up menu. |
| 7. | Finally, click on “is not equal to” and change it to . |
Notice that “the probability of getting a value of z this great or greater would be 0.21.” This means that we cannot rule out chance as an explanation for the observed difference of proportions.
|
|
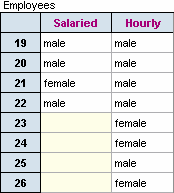
Now we’ll consider the less preferred data structure, in which one attribute records the sex of the salaried employees and another attribute records the sex of the hourly employees. This structure is less preferred because a case in this collection doesn’t have any meaning; it’s just an arbitrary pairing of one salaried and one hourly employee.
A portion of the data is shown at right. The blank cells for cases 23 through 26 in the salaried column make clear that there are a different number of employees in each group.
|
|
In this situation, it doesn’t make any difference which attribute you drop in which slot of the test object.
Once you have dropped the two attributes, the text of the test object will fill in with something nonsensical, similar to what is shown. The problem, of course, is that Fathom is assuming that the attributes conform to the preferred structure.
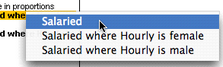
To fix things, click your mouse on the first part of the phrase and choose the single-word option, in this case .
|
|
This change results in Fathom treating each attribute as a group and comparing the proportion in one with the proportion in the other.
•Change the category being used for comparison by clicking on the chosen category, in this case .
|