Compare Proportions from Summary Data


Compare Proportions from Summary Data |
|
|
How To... > Work with Statistical Objects > Test Hypotheses > Compare Proportions from Summary Data Sometimes you don’t have the raw data from which you wish to test that one proportion is the same as another. Let’s take a concrete example in which you know the counts for sex and job classification (salaried or hourly) of 42
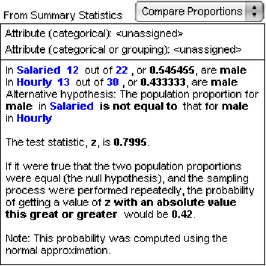
employees and you wish to carry out a hypothesis test of whether or not the greater proportion of males in the salaried positions, as compared with the hourly positions, is explainable by chance. The summary data are as follows: Salaried, female: 10 Salaried, male: 12 Hourly, female: 17 Hourly, male: 13
You get a test comparing proportions, with default values; the blue fields are editable.
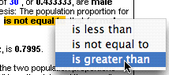
As you enter values, the text changes throughout the object. The result for our example is shown here. By default, the test object is configured for a two-tailed test, but in our example, we’re interested specifically in whether the proportion of males for the salaried jobs is greater than it is for the hourly jobs.
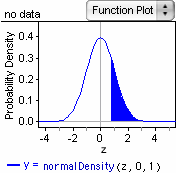
Looking at the result, we see that the p-value for this test is 0.21, meaning that about 20% of the time we would get this level of difference between the two proportions just by chance. Thus, we cannot rule out chance as the cause of the difference. It is helpful to get a visual feeling for the p-value.
The result is the function plot shown here, with the area to the right of the computed value for z (0.7995) shaded to show the proportion of the time this value or greater would be obtained if the null hypothesis were true. |