Test Proportion Against a Value from Raw Data


Test Proportion Against a Value from Raw Data |
|
|
How To... > Work with Statistical Objects > Test Hypotheses > Test Proportion Against a Value from Raw Data
When you have collected data that contain categorical information, one question you can ask is whether the proportion of cases corresponding to a certain category differs from some particular value. Fathom’s test proportion object will help you answer this question by computing the probability that the difference you observe could reasonably happen by chance.
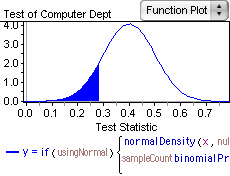
This example deals with the situation in which only 28% of the staff in a computer department are women, while the industry average is 40%. The question is whether something other than chance is required to explain this difference. The test shows that 11% of the time you would expect to get a difference this great or greater just by chance
Note that, as usual, you can edit various parts of this test. •A pop-up menu under the category name allows you to change the category whose proportion is being tested. •A pop-up menu under the phrase describing the direction of the test can be used to change the direction. •You can edit by typing or by providing a formula for the test proportion. Choosing Test | Show p_hat Distribution displays a plot similar to the one at right, with the proportion of the area under the distribution equal to the test’s p-value. For this test, Fathom uses the normal approximation to the binomial distribution when n*p ≥ 10 and n*(1 - p) ≥ 10. Under these conditions, it will compute a z-statistic. Otherwise, it will use a binomial statistic. (The test itself tells you which is used.) |