Change the Size of Data Points


Change the Size of Data Points |
|
|
How To... > Work with Graphs > Change the Size of Data Points
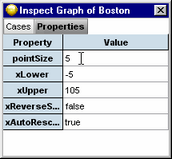
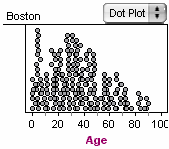
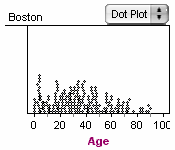
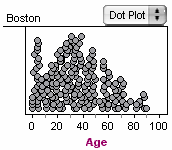
The figures above show a graph with the default point size of 5, changed to 3, then to 7. Point size is in pixels. You may need to experiment to get the look you want.
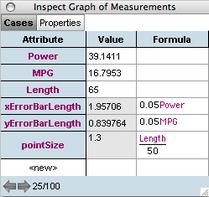
You can also control the size of data points using a formula that depends on other attribute values. 1.Go to the graph inspector's Cases panel. 2.Click in the formula column of the property pointSize. 3.Enter the formula that will determine the point size. This formula will use the base point size specified in the property pointSizeMultiplier.
If you want to make everything in the document bigger (all fonts and other elements in all objects), for giving a presentation projected onto a screen, for example, you should change the document preference to use a larger font size in objects. See Preferences. |