Change Bin Width


Change Bin Width |
|
|
How To... > Work with Graphs > Change Bin Width
When looking at a histogram or ntigram, you may find it informative to see how the graph looks with different bin sizes. There are two ways to accomplish this: dynamically, by dragging a bin edge, or numerically, by typing a bin width (histogram) or bin number (ntigram) in the Properties panel of its inspector. There’s a movie that covers both methods A Dot Plot, a Histogram, and a Box Plot.
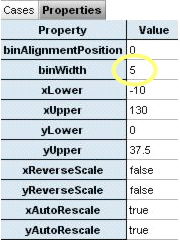
1. Double-click the graph, to show its inspector (if necessary, go to the Properties panel).
2. Change the value for the binWidth property. (For ntigrams, change the numBins property.)
See also |