Show Squares


Show Squares |
|
|
Fathom Reference > Fathom Menus > Graph Menu > Show Squares
Available when the selected graph has a computed line, a movable line, or a plotted value or function.
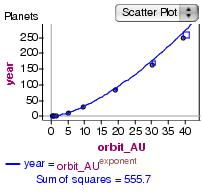
Fathom constructs a vertical line from each point to each line on the graph, then makes those segments into sides of squares; the sum of the areas of these squares is computed and reported below the plot area.
This feature is great for demonstrating the meaning of the least-squares line (the line that minimizes the sum of the squares of the residuals).
The squares and their total area dynamically update when the data change or a line is moved. (This can be from moving a movable line, or changing a computed line by changing the data, or changing a function using a slider.)
See also |