Scatter Plot


Scatter Plot |
|
|
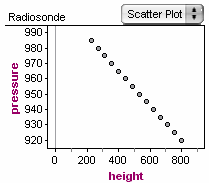
Fathom Reference > Graphs Available in Fathom > Graphs with Numeric Attributes on Both Axes > Scatter Plot In a scatter plot, there is one point for each case at the position indicated by the values on each axis. •Drop a numeric attribute on each axis.
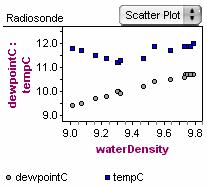
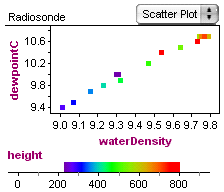
You can add more numeric attributes to one of the axes or drop any attribute in the plot area.
|