When you have data with categorical information, you can use a goodness of fit test to determine whether or not the distribution of values among the categories conforms to what was expected. The most common situation is that all categories are expected to be equal.
| 1. | Create a new test by dragging one from the or by choosing . |
| 2. | From the test’s pop-up menu, choose . |
| 3. | Drop a categorical attribute on the prompt at the top of the object. |
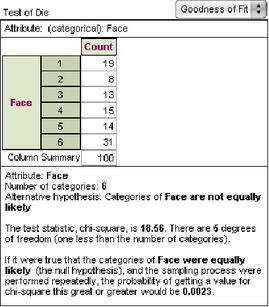
As an example, suppose you have rolled a particular die 100 times, with the results shown in this table. Just by inspection, you suspect that the die is loaded in favor of 6. But couldn’t this happen by chance?
The result shows that, yes, it could happen by chance, but only about two times out of a thousand; therefore, you are justified in claiming that the die is loaded.
But not every situation tests for equal probability for each category. For example, you are told what the proportion of different colors of M&M candies is supposed to be. You want to see, given a random sample of 120, whether those proportions are reasonable.
|

|


