Make a New Summary Table


Make a New Summary Table |
|
|
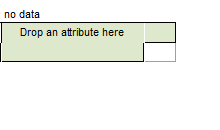
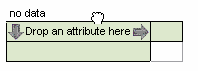
How To... > Work with Summary Tables > Make a New Summary Table As with looking at data in graphs, to look at summary statistics, you first make an empty summary table, then add attributes by dropping them on a highlighted spot.
When you drag an attribute over a summary table, arrows appear around the prompt. You can drop the attribute on the prompt (one of the arrows will highlight, indicating where the attribute will be put), or on the column header to the right of the prompt, or on the row header below the prompt (these areas highlight when an attribute is held over them).
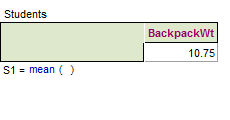
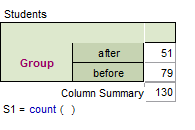
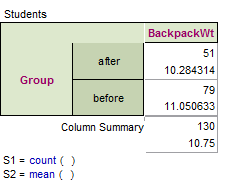
By default, dropping a numeric attribute on one dimension gives you the mean; dropping a categorical attribute gives you counts for each category; dropping numeric attributes on both dimensions gives you correlation; and putting numeric attributes on one dimension and categorical on the other gives both means and counts.
•You can edit a formula by double-clicking it to show a formula editor. •You can add a new formula (and show the formula editor) by choosing Summary | Add Formula (see Add or Remove a Summary Table’s Formulas). •You can add a bunch of formulas at once by choosing Summary | Add Basic Statistics or Add Five-Number Summary (see Add Basic Statistics or Add Five-Number Summary). See also Add or Remove a Summary Table’s Attributes |