|
How To... > Work with Statistical Objects > Test Hypotheses > Goodness of Fit (Chi-Square Test) from Summary Data: Unequal Probabilities
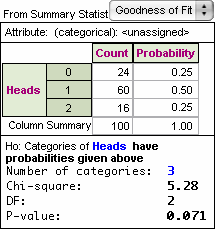
There are certainly many situations in which categorical outcomes are not expected to be equally likely. Here we’ll consider flipping a pair of coins 100 times and keeping track of the number of times you get 0 heads, 1 head, and 2 heads. Theoretically, these outcomes have probabilities 0.25, 0.50, and 0.25, respectively.
| 1. | Create a new test by dragging one from the or by choosing . |
| 2. | From the pop-up menu in the test’s upper-right corner, choose . |
| 3. | Edit the attribute name (in blue) to be Heads. |
| 4. | Enter the number of categories (in this case 3). |
The table will create three editable rows.
| 5. | Change the row category names from their defaults to “0,” “1,” and “2.” |
Notice that the test is, so far, assuming equal likelihood.
| 6. | Click on the phrase “are equally likely” and choose from the pop-up menu. |
Notice that the table gets a column for probabilities.
| 7. | Enter the appropriate probabilities for each row. |
The chi-square statistic and associated p-value are displayed below the table.
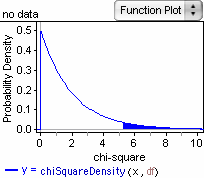
With the test object selected, choose to display a plot of the chi-square distribution with shading to show the probability of getting a statistic as large or larger than the one observed.
|