F-Distribution


F-Distribution |
|
|
Fathom Reference > Fathom Operators, Functions, and Units > Distribution Functions > F-Distribution
The F-distribution is used to compute p-values in a one-way analysis of variance. Under the null hypothesis, the test statistic in this analysis (called, appropriately enough, the F-ratio) is a random variable from an F-distribution.
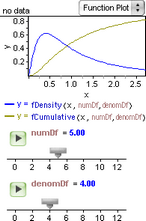
The ratio referred to is the ratio of the mean square for treatments and the mean square for error. Each of these has associated with it a number of degrees of freedom. There is a different F-distribution for each distinct pair of degrees of freedom. These are labeled numDf and denomDf in the list that follows, corresponding to numerator and denominator. The function plot here shows a plot of both the density and the cumulative probability for the F-distribution, where sliders have been used to make it easy to explore the effect of the two parameters on the shape of the distribution.
F-distribution functions also take two optional parameters: scale, which defaults to 1, and min, which defaults to 0.
|