Building the Model


Building the Model |
|
|
How To... > Work with Statistical Objects > Build a Linear Model > Multiple Regression > Building the Model
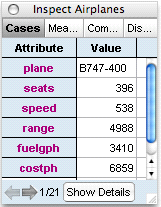
To make this explanation concrete, we’ll use the Airplanes.ftm sample document that comes with Fathom. This document contains a collection of 21 airplanes, with the six attributes shown in the inspector at right. We would like to be able to predict the cost per hour of operating an airplane based on some linear combination of the four other numeric attributes. For now, we’re going to concentrate on the mechanics of building the model, without explaining much about the underlying statistics or attempting to show good practice. You’ll have to get this from a book or course.
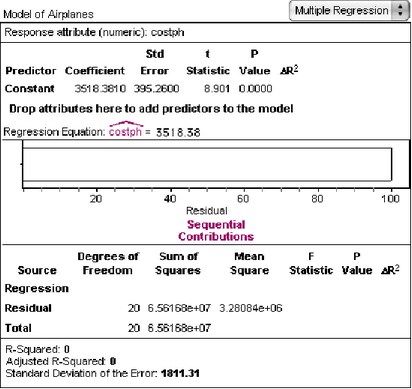
You will almost certainly need to resize the model so you can see all of its parts. It should look similar to the following illustration:
Notice the regression equation in the second pane from the top. Even without any predictors, we are not completely in the dark; we can use the mean of the predicted values, and that’s what the equation says. Also notice the empty horizontal bar. The fact that it is empty represents the fact that 100% of the variation from the mean is, as yet, unexplained. Our goal is to fill in that bar.
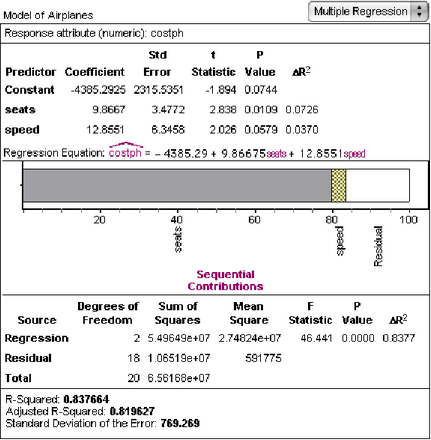
You should have something like this:
Each row in the table in the top indicates the incremental effect of adding this predictor to the model last, that is, after all of the other predictors. Conversely, it can be viewed as the contribution that would be lost if this predictor were removed from the model. These results will change as predictors are added and removed from the model, but not when the order of predictors is changed. Each section of the ribbon in the ribbon chart corresponds to the incremental effect of adding its predictor in its current position. Changing the order of the predictors will change the graph, but adding or removing predictors to the model won’t affect the contributions of predictors that precede the change. By default the ANOVA table at the bottom shows the portion of the variance accounted for by the model. To show the incremental effect of adding each predictor to the model, choose Model | Show Predictors In ANOVA Table. The final section of the multiple regression model contains results for the model as a whole. |